s-tui CPU Monitoring And Stress Testing Tool Sees Its First Stable (1.0.0) Release
s-tui, a terminal-based CPU monitoring and stress testing tool for Linux, has reached version 1.0.0 stable after being in development for almost 3 years.
s-tui monitors the CPU frequency, utilization, temperature, fan speeds and power using colored graphs, while also showing performance dips caused by thermal throttling.
The tool also has built-in options for stress testing the CPU using third party tools like

The TUI (terminal user interface) application has a responsive interface, similar to bandwhich, so the information it shows depends on the size of the terminal window. For the sidebar though, you can use
In case you want to use it in a TTY and it crashes on start, run it with the
Another cool s-tui feature is the ability to run a shell script when a certain threshold is exceeded.
For the 1.0.0 release, s-tui went through some important under the hood and user interface changes. With this first stable release, there are now multiple graphs for each source - the CPU temperature, frequency and usage graphs are now per core, etc. Also, the all the information presented in the sidebar is now in text form.
Related: gotop: Graphical System Monitor For The Command Line
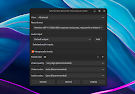
In previous versions you could only toggle the graphs on or off. With s-tui 1.0.0, you can toggle both the side menu items and graphs on off. There are now two sections, called Graphs and Summaries, from where you can enable or disable any graph or sidebar information. Also, selected graphs are now stored for future uses.
There have also been some important under the hood changes, with everything being made a lot more modular. This should make it a lot easier to add a new source, by simply implementing all the class methods.
It's also worth noting that some features were removed in this release in order to make s-tui more modular: reading the maximum frequency with root for all cores, and displaying the maximum recorded temperature. Another menu showing the maximum / minimum / average for all sensors is planned for a future release.
s-tui is available in the official repositories for some Linux distributions, including Debian Buster and newer, Ubuntu 19.04 and newer, Arch Linux / Manjaro and openSUSE. Though as expected, it's not yet updated to the latest version in most cases (and in Ubuntu it won't be until Ubuntu 20.04).
The s-tui installation instructions mention the option of installing s-tui using pip, but since the instructions mention using "pip" directly, which can point to either Python2 or Python3 depending on the used Linux distribution, I thought I'd mention that you must install it using Python3. E.g. this should install the latest s-tui:
The s-tui executable is installed in
To stress test the CPU, install the
s-tui monitors the CPU frequency, utilization, temperature, fan speeds and power using colored graphs, while also showing performance dips caused by thermal throttling.
The tool also has built-in options for stress testing the CPU using third party tools like
stress or stress-ng. FIRESTARTER is also supported as an external tool for stress-testing the CPU, but do note that you need to install s-tui from source for this, and it doesn't work on all systems.
The TUI (terminal user interface) application has a responsive interface, similar to bandwhich, so the information it shows depends on the size of the terminal window. For the sidebar though, you can use
h j k l to navigate it without resizing the terminal window. If you prefer to use the mouse instead of keyboard, you can do that as s-tui has mouse support. In case you want to use it in a TTY and it crashes on start, run it with the
--no-mouse option to disable mouse input support, and get around this issue.Another cool s-tui feature is the ability to run a shell script when a certain threshold is exceeded.
For the 1.0.0 release, s-tui went through some important under the hood and user interface changes. With this first stable release, there are now multiple graphs for each source - the CPU temperature, frequency and usage graphs are now per core, etc. Also, the all the information presented in the sidebar is now in text form.
Related: gotop: Graphical System Monitor For The Command Line
In previous versions you could only toggle the graphs on or off. With s-tui 1.0.0, you can toggle both the side menu items and graphs on off. There are now two sections, called Graphs and Summaries, from where you can enable or disable any graph or sidebar information. Also, selected graphs are now stored for future uses.
There have also been some important under the hood changes, with everything being made a lot more modular. This should make it a lot easier to add a new source, by simply implementing all the class methods.
It's also worth noting that some features were removed in this release in order to make s-tui more modular: reading the maximum frequency with root for all cores, and displaying the maximum recorded temperature. Another menu showing the maximum / minimum / average for all sensors is planned for a future release.
Install s-tui
s-tui is available in the official repositories for some Linux distributions, including Debian Buster and newer, Ubuntu 19.04 and newer, Arch Linux / Manjaro and openSUSE. Though as expected, it's not yet updated to the latest version in most cases (and in Ubuntu it won't be until Ubuntu 20.04).
The s-tui installation instructions mention the option of installing s-tui using pip, but since the instructions mention using "pip" directly, which can point to either Python2 or Python3 depending on the used Linux distribution, I thought I'd mention that you must install it using Python3. E.g. this should install the latest s-tui:
python3 -m pip install --upgrade --user s-tuiThe s-tui executable is installed in
~/.local/bin so make sure this directory is in your PATH. If it's not, open ~/.bashrc (or ~/.zshrc, etc., depending on what you're using) with a text editor and add this at the bottom of the file: export PATH=$PATH:$HOME/.local/bin, open a new terminal and you'll be able to run s-tui without typing its full path.To stress test the CPU, install the
stress or stress-ng package - it should be in the repositories for most Linux distributions.