gotop: Graphical System Monitor For The Command Line
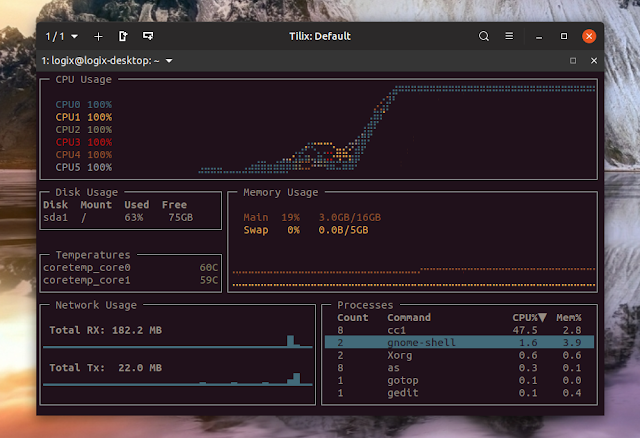
gotop is a terminal-based (TUI) system monitor for Linux and macOS. The software is inspired by gtop and vtop, but while these 2 utilities use Node.js, gotop is written in Go.
The command line tool supports mouse clicking and scrolling, comes with vi-keys, and it displays the CPU, memory and network usage history using colored graphs, while also displaying their current values.
gotop also shows the disk usage, temperatures and a top process list, which includes CPU and memory usage.
The process list allows toggling process grouping, and a process can be killed by typing
dd. While you can sort the process list by CPU or memory usage, you can't filter / search for a particular process, change their priority (renice), or show a process tree, like in top or htop utilities.The memory and CPU graphs can be scaled by using
h (scale in) and l (scale out). This information does not appear in the gotop help screen (that can be accessed using ?), so I thought I'd mention it here.Related: s-tui: CPU Monitoring And Stress Testing Console UI Tool
gotop 2.0.0, released a few days ago, also adds an option to show a battery widget (
--battery), and a status bar (--statusbar), that must be explicitly called when running gotop. The status bar doesn't show on my system when activated though, so there must be some bug or something I missed.Other gotop features include:
- built-in color schemes (default, default-dark, solarized and monokai)
- option to only show CPU, Mem and Process widgets
- option to set the polling rate for CPU and Memory widgets
- option to show each CPU or the average CPU usage in the CPU widget
- option to show temperatures in Fahrenheit degrees (instead of the default Celsius)
It's worth noting that some gotop widgets are constrained by the terminal size. For example, you may not see all the available CPUs in the CPU usage list on the left unless you increase the terminal height. The same goes for the disks under Disk Usage, and the sensors from the Temperatures list.
Downloading and installing gotop
On the downloads page you'll find the source code, Linux and macOS binaries.
To install the gotop binary on Linux, start by downloading the binary for your OS architecture. In most cases, that's 64bit, so download the archive ending in
linux_amd64.tgz. Extract the downloaded archive and install it somewhere in your $PATH.As an example, if the gotop binary is extracted in the current folder, you can install it to
/usr/local/bin using:sudo install gotop /usr/local/bin/Now you can start it by typing gotop in a terminal:
gotopFor how to use gotop, press
? which displays some information on working with its TUI (terminal user interface). For more options run gotop --help:$ gotop --help
Usage: ./gotop [options]
Options:
-h, --help Show this screen.
-c, --color string Set a colorscheme. (default "default")
-S, --graphscale int Graph scale factor, >0 (default 7)
-v, --version Print version and exit.
-V Print version and exit.
-p, --percpu Show each CPU in the CPU widget. (default true)
-a, --averagecpu Show average CPU in the CPU widget.
-f, --fahrenheit Show temperatures in fahrenheit.Show temperatures in fahrenheit.
-s, --statusbar Show a statusbar with the time.
-r, --rate 1m Refresh frequency. Most time units accepted. 1m = refresh every minute. `100ms` = refresh every 100ms. (default 1s)
-l, --layout string Name of layout spec file for the UI. Use "-" to pipe. (default "default")
-i, --interface ! Select network interface. Several interfaces can be defined using comma separated values. Interfaces can also be ignored using ! (default "all")
-x, --export string Enable metrics for export on the specified port.
--mbps Show network rate as mbps.
--test Runs tests and exits with success/failure code.
-C string Config file to use instead of default (MUST BE FIRST ARGUMENT)
--list string List <devices|layouts|colorschemes|paths|keys>
devices: Prints out device names for filterable widgets
layouts: Lists build-in layouts
colorschemes: Lists built-in colorschemes
paths: List out configuration file search paths
widgets: Widgets that can be used in a layout
keys: Show the keyboard bindings.
--write-config Write out a default config file.


